
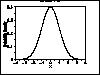
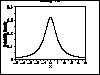
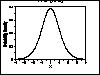
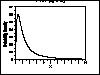
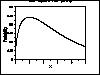
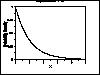
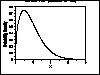
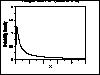
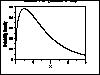
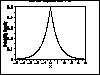
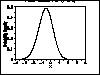
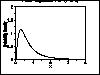
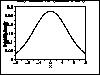
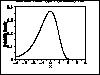
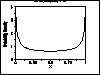
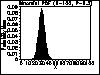
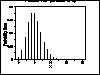
Probability distribution. Gallery of Distributions Gallery of Common Distributions Detailed information on a few of the most common distributions is available below. There are a large number of distributions used in statistical applications. It is beyond the scope of this Handbook to discuss more than a few of these. Two excellent sources for additional detailed information on a large array of distributions are Johnson, Kotz, and Balakrishnan and Evans, Hastings, and Peacock. Equations for the probability functions are given for the standard form of the distribution. Formulas exist for defining the functions with location and scale parameters in terms of the standard form of the distribution. The sections on parameter estimation are restricted to the method of moments and maximum likelihood. This is because the least squares and PPCC and probability plot estimation procedures are generic. The maximum likelihood equations are not listed if they involve solving simultaneous equations. This is because these methods require sophisticated computer software to solve. Except where the maximum likelihood estimates are trivial, you should depend on a statistical software program to compute them. References are given for those who are interested. Be aware that different sources may give formulas that are different from those shown here. In some cases, these are simply mathematically equivalent formulations. In other cases, a different parameterization may be used. Continuous Distributions Normal Distribution Uniform Distribution Cauchy Distribution t Distribution F Distribution Chi-Square Distribution Exponential Distribution Weibull Distribution Lognormal Distribution Birnbaum-Saunders (Fatigue Life) Distribution Gamma Distribution Double Exponential Distribution Power Normal Distribution Power Lognormal Distribution Tukey-Lambda Distribution Extreme Value Type I Distribution Beta Distribution Discrete Distributions Binomial Distribution Poisson Distribution


Probability Distributions

Probability DistributionsProbability distributions are a fundamental concept in statistics. They are used both on a theoretical level and a practical level.Some practical uses of probability distributions are:
  • To calculate confidence intervals for parameters and to calculate critical regions for hypothesis tests.
  • For univariate data, it is often useful to determine a reasonable distributional model for the data.
  • Statistical intervals and hypothesis tests are often based on specific distributional assumptions. Before computing an interval or test based on a distributional assumption, we need to verify that the assumption is justified for the given data set. In this case, the distribution does not need to be the best-fitting distribution for the data, but an adequate enough model so that the statistical technique yields valid conclusions.
  • Simulation studies with random numbers generated from using a specific probability distribution are often needed.

.

Gallery of Distributions

Gallery of Common DistributionsDetailed information on a few of the most common distributions is available below. There are a large number of distributions used in statistical applications. It is beyond the scope of this Handbook to discuss more than a few of these. Two excellent sources for additional detailed information on a large array of distributions areJohnson, Kotz, and Balakrishnan and Evans, Hastings, and Peacock. Equations for the probability functions are given for thestandard form of the distribution. Formulas exist for defining the functions with location and scale parameters in terms of the standard form of the distribution.The sections on parameter estimation are restricted to the method of moments and maximum likelihood. This is because the least squares and PPCC and probability plot estimation procedures are generic. The maximum likelihood equations are not listed if they involve solving simultaneous equations. This is because these methods require sophisticated computer software to solve. Except where the maximum likelihood estimates are trivial, you should depend on a statistical software program to compute them. References are given for those who are interested.
Be aware that different sources may give formulas that are different from those shown here. In some cases, these are simply mathematically equivalent formulations. In other cases, a different parameterization may be used.
Continuous DistributionsNormal Distribution
Normal Distribution
Uniform Distribution
Cauchy Distribution
Cauchy Distribution
t Distribution
t Distribution
F Distribution
F Distribution
Chi-Square Distribution
Exponential Distribution
Weibull Distribution
Lognormal Distribution
Birnbaum-Saunders (Fatigue Life) Distribution
Gamma Distribution
Gamma Distribution
Double Exponential Distribution
Power Normal Distribution
Power Lognormal Distribution
Tukey-Lambda Distribution
Extreme Value Type 1 Distribution
Extreme Value Type I Distribution
Beta Distribution
Beta Distribution
Discrete DistributionsBinomial Distribution
Binomial Distribution
Poisson Distribution

Comments

Popular posts from this blog

Double exponential distribution

Double Exponential Distribution Probability Density Function The general formula for the  probability density function  of the double exponential distribution is where   is the  location parameter  and   is the  scale parameter . The case where   = 0 and   = 1 is called the  standard double exponential distribution . The equation for the standard double exponential distribution is Since the general form of probability functions can be  expressed in terms of the standard distribution , all subsequent formulas in this section are given for the standard form of the function. The following is the plot of the double exponential probability density function. Cumulative Distribution Function The formula for the  cumulative distribution function  of the double exponential distribution is The following is the plot of the double exponential cumulative distribution function. Percent Point Function The formula for the  percent point function  of the double exponential distribution

Runs Test for Detecting Non-randomness

Runs Test for Detecting Non-randomness Purpose: Detect Non-Randomness The runs test ( Bradley, 1968 ) can be used to decide if a data set is from a random process. A run is defined as a series of increasing values or a series of decreasing values. The number of increasing, or decreasing, values is the length of the run. In a random data set, the probability that the ( I +1)th value is larger or smaller than the I th value follows a binomial distribution , which forms the basis of the runs test. Typical Analysis and Test Statistics The first step in the runs test is to count the number of runs in the data sequence. There are several ways to define runs in the literature, however, in all cases the formulation must produce a dichotomous sequence of values. For example, a series of 20 coin tosses might produce the f

Basics of Sampling Techniques

Population                A   population   is a group of individuals(or)aggregate of objects under study.It is also known as universe. The population is divided by (i)finite population  (ii)infinite population, (iii) hypothetical population,  subject to a statistical study . A population includes each element from the set of observations that can be made. (i) Finite population : A population is called finite if it is possible to count its individuals. It may also be called a countable population. The number of vehicles crossing a bridge every day, (ii) Infinite population : Sometimes it is not possible to count the units contained in the population. Such a population is called infinite or uncountable. ex, The number of germs in the body of a patient of malaria is perhaps something which is uncountable   (iii) Hypothetical population : Statistical population which has no real existence but is imagined to be generated by repetitions of events of a certain typ